import telebot

import matplotlib.pyplot as plt
import pandas_datareader as web
import datetime as dt

token = 'token'
bot=telebot.TeleBot(token)

@bot.message_handler(commands=['start'])
def start_message(message):
    bot.send_message(message.chat.id, 'Привет, введи тикер')


@bot.message_handler(content_types='text')
def png_message(message):
    company = message.text

    start = dt.datetime(2018, 1, 1)
    end = dt.datetime(2022, 1, 1)

    data = web.DataReader(company, 'yahoo', start, end)

    test_start = dt.datetime(2020, 1, 1)
    test_end = dt.datetime.now()

    test_data = web.DataReader(company, 'yahoo', test_start, test_end)
    actual_prices = test_data['Close'].values

    plt.plot(actual_prices, color="blue", label=f"Actual {company} Price")

    plt.xlabel('TIME')
    plt.ylabel(f'{company} Share Price')
    plt.legend()
    plt.savefig(f'{company}.png')
    bot.send_photo(message.chat.id, open(f'{company}.png', 'rb'))
bot.polling(none_stop=True)
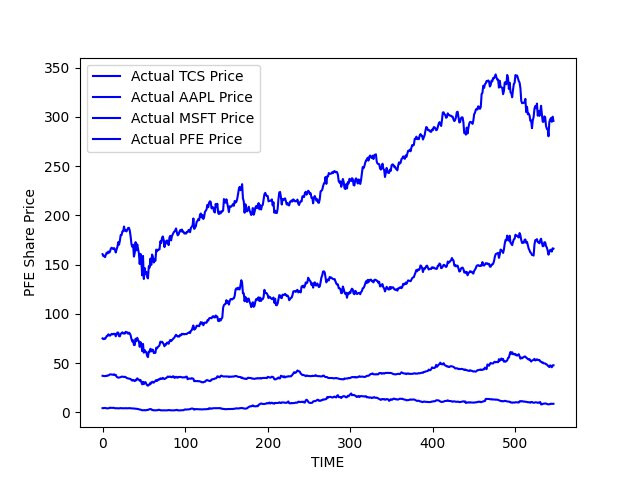
Здравствуйте всем! Пишу телеграмм-бота на Питоне, который выводит график по акциям компаний. Ввод первого тиккера успешен, но далее идет наслоение графика на одну систему координат. Подскажите, пожалуйста, как это исправить? Заранее спасибо!